CALCULATING BUSINESS METRICS

Scenario:
Your Manager requires you to provide a report that summarizes the performance of your Company in terms of its Revenue, Sales, Customer Satisfaction, and Website Performance. He will then set a monthly recurring meeting to present these business metrics.
Task:
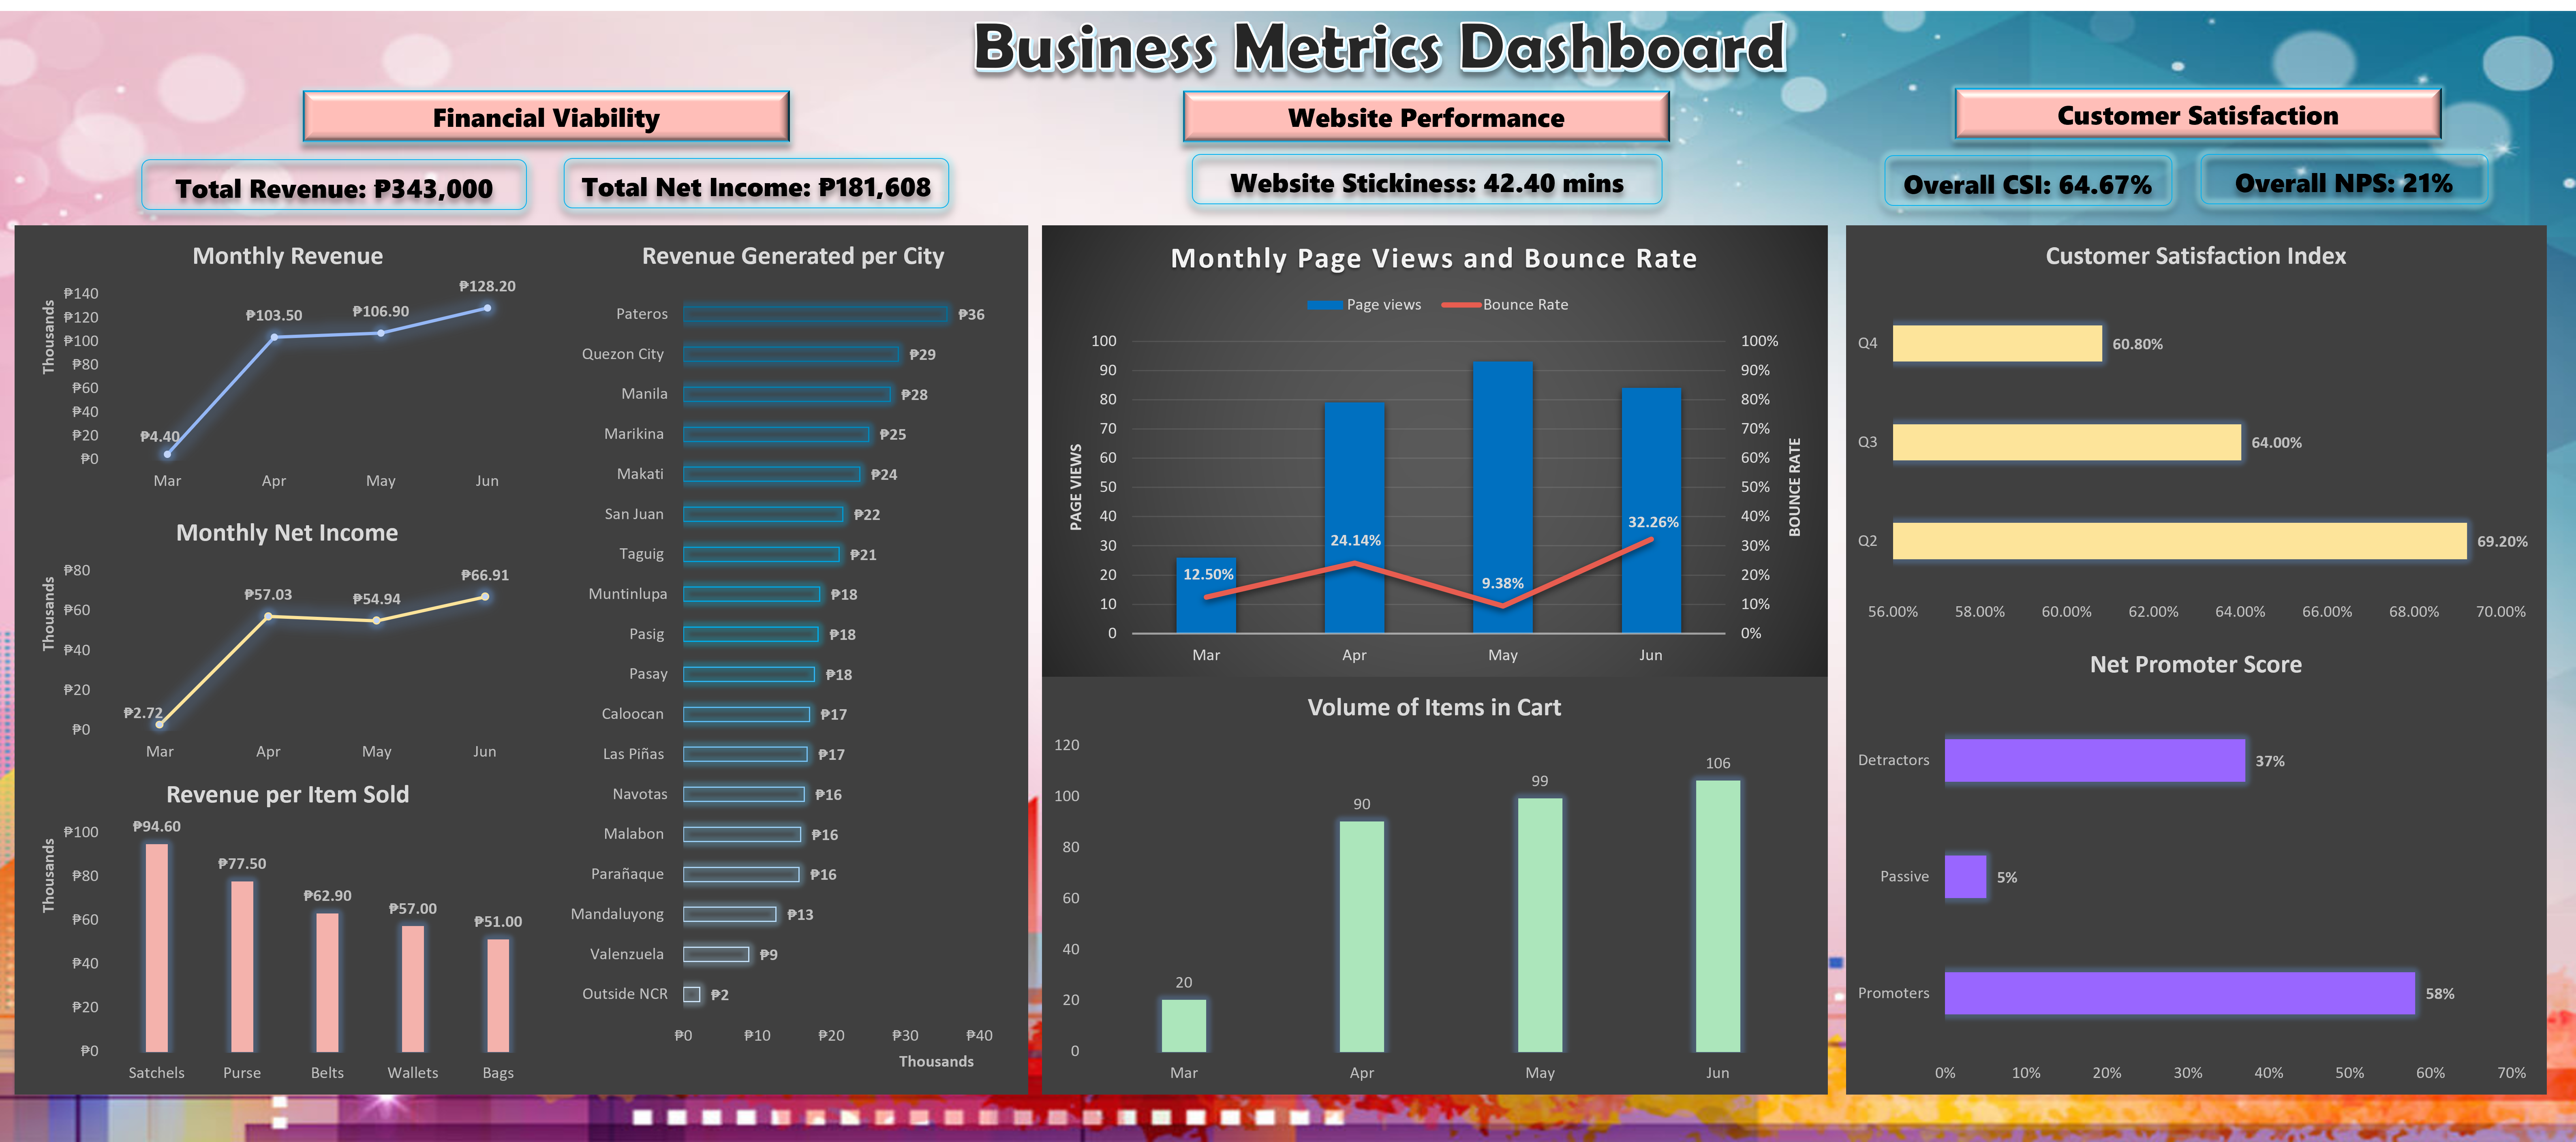
Analyze and provide a report on the required metrics. Build a dashboard using either MS Excel or PowerBI after processing the data and calculating the required figures for the report.
The Dashboard should contain the following:
1. Financial Viability
a. Revenue
b. Net Income
c. Revenue per item sold
d. Revenue Generated per City
2. Website Performance
a. Bounce Rate
b. Total Monthly Page Views
c. Volume of items in cart
3. Customer Satisfaction
a. Customer Satisfaction Index
b. Net Promoter Score
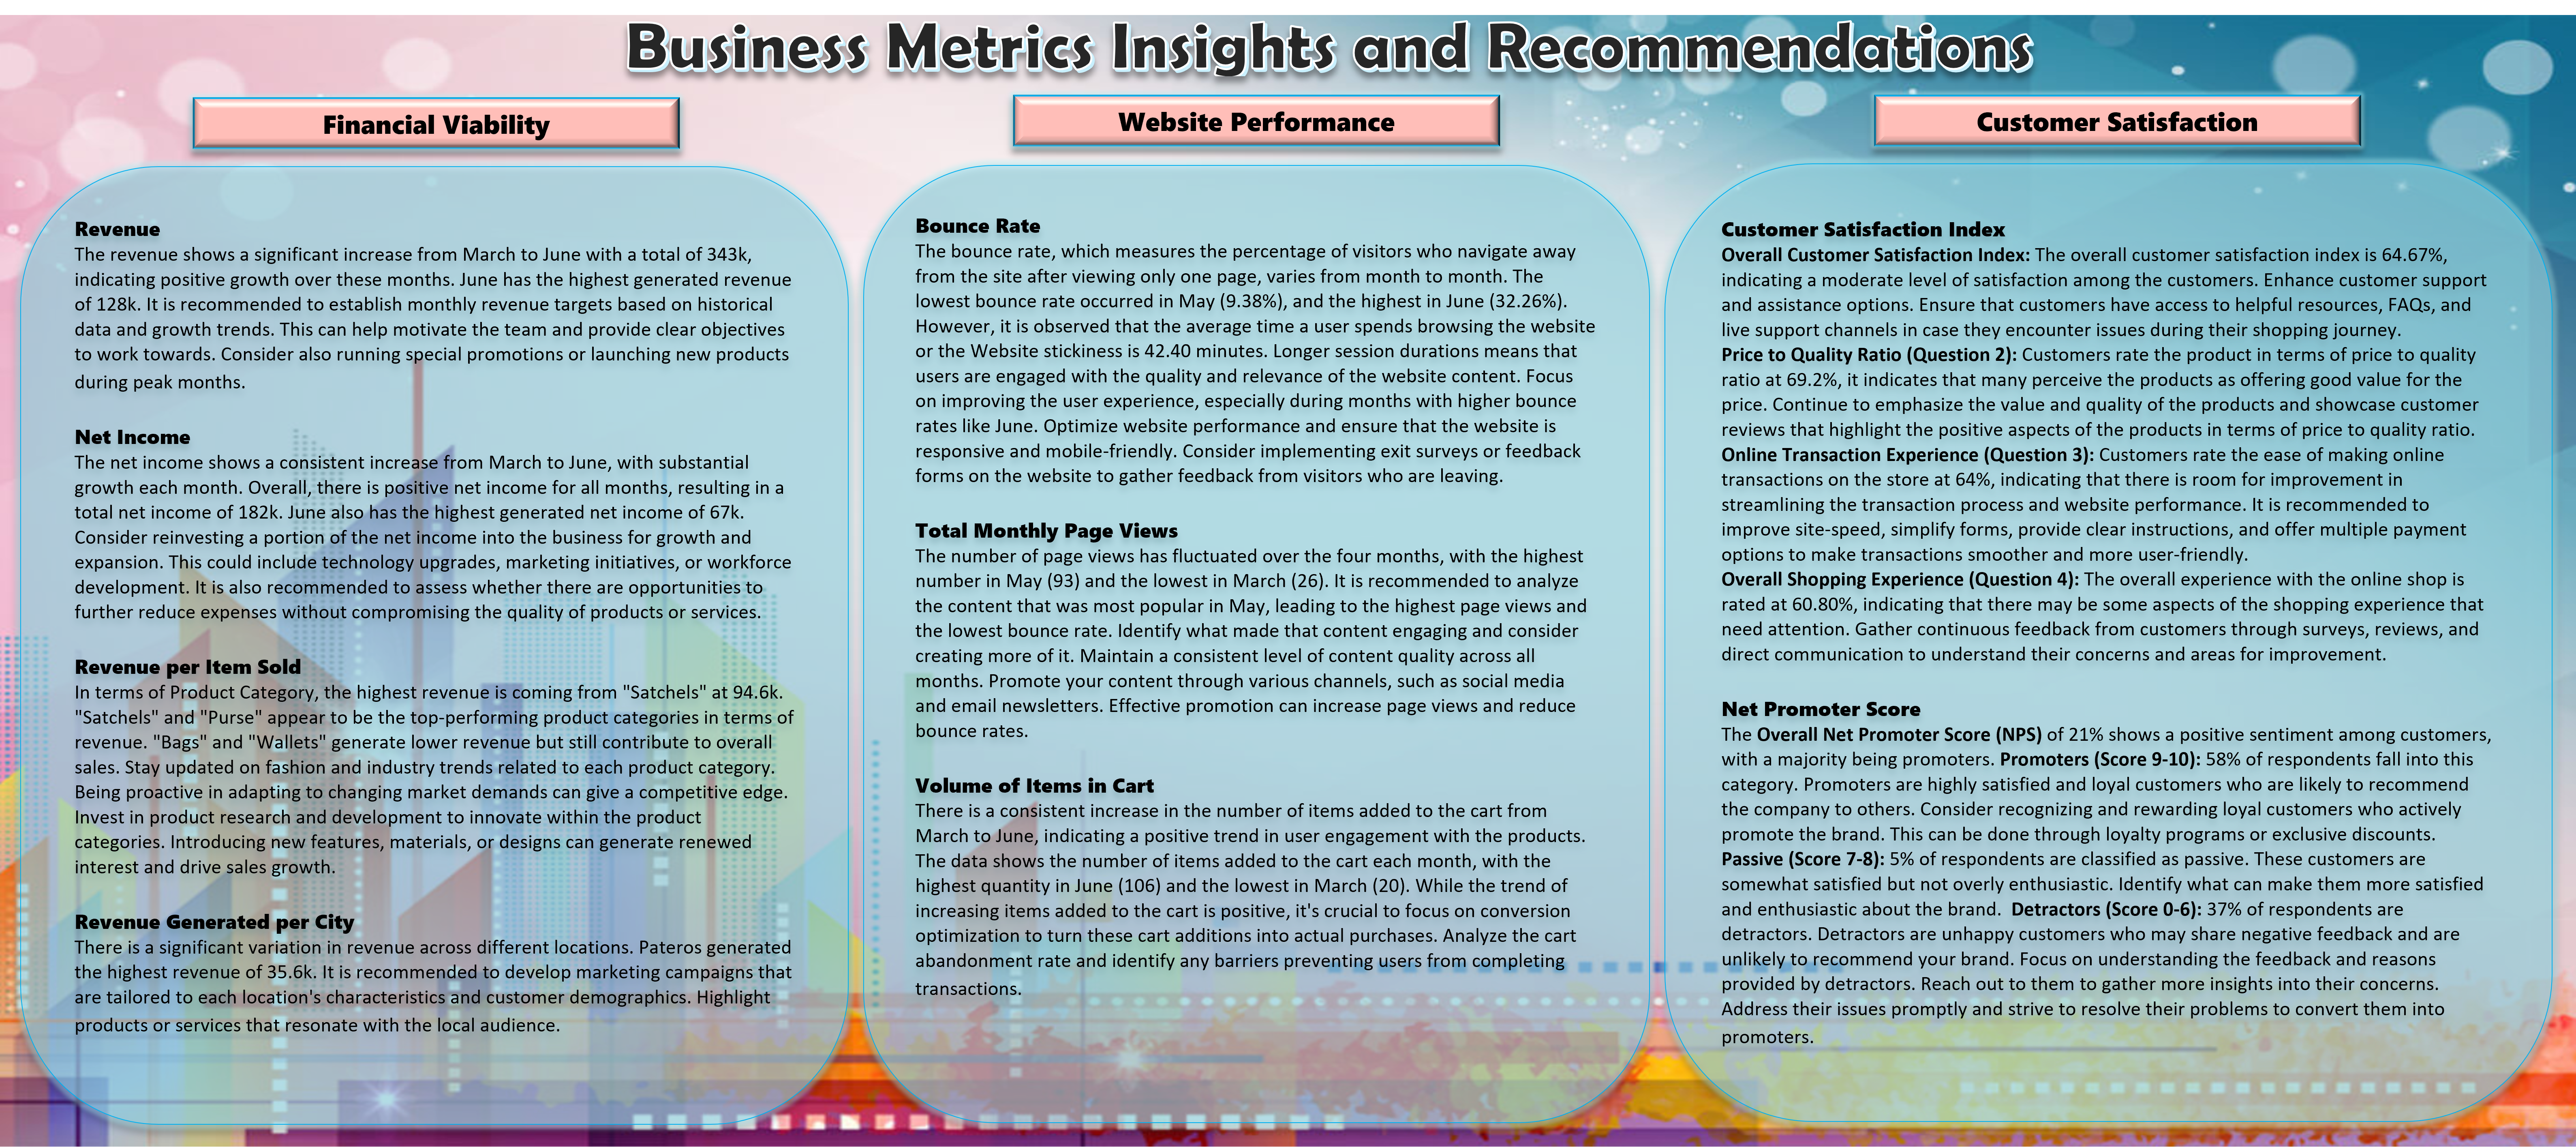
Remember, the audience for the report presentation is not well-oriented in Data Analytics and would prefer a less technical approach in presenting data.
In this task, we calculated the required Business Metrics and created a Dashboard using Excel.


Please refer to attached file for the detailed report.
