CREATING A DASHBOARD FOR CLOCKSTER

Overview
As part of a data analysis team within the HR department of a medical company, we are tasked with handling a substantial dataset that encompasses 10-15 parameters per day, per year, for over a thousand employees in the organization. These parameters include information related to their arrival and departure times, vacation days, sick leave, and other related data points.
The task involves responding to the following questions that have been formulated by the CEO:
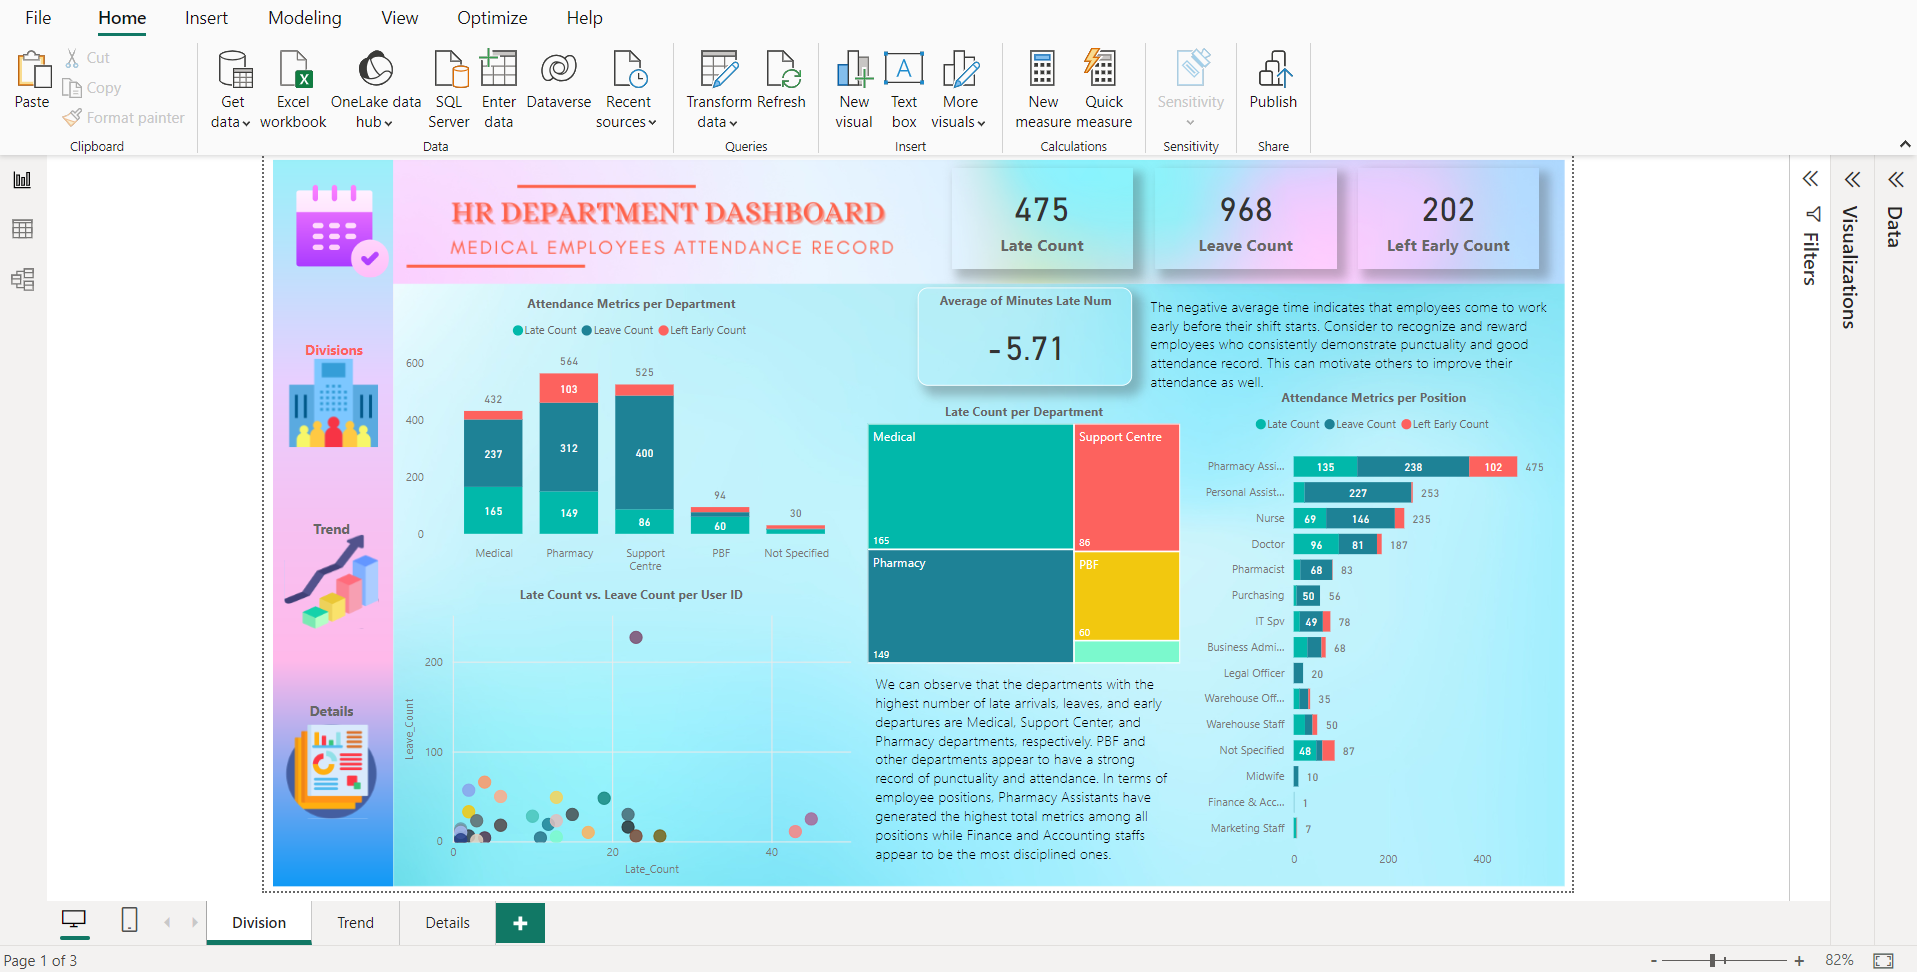
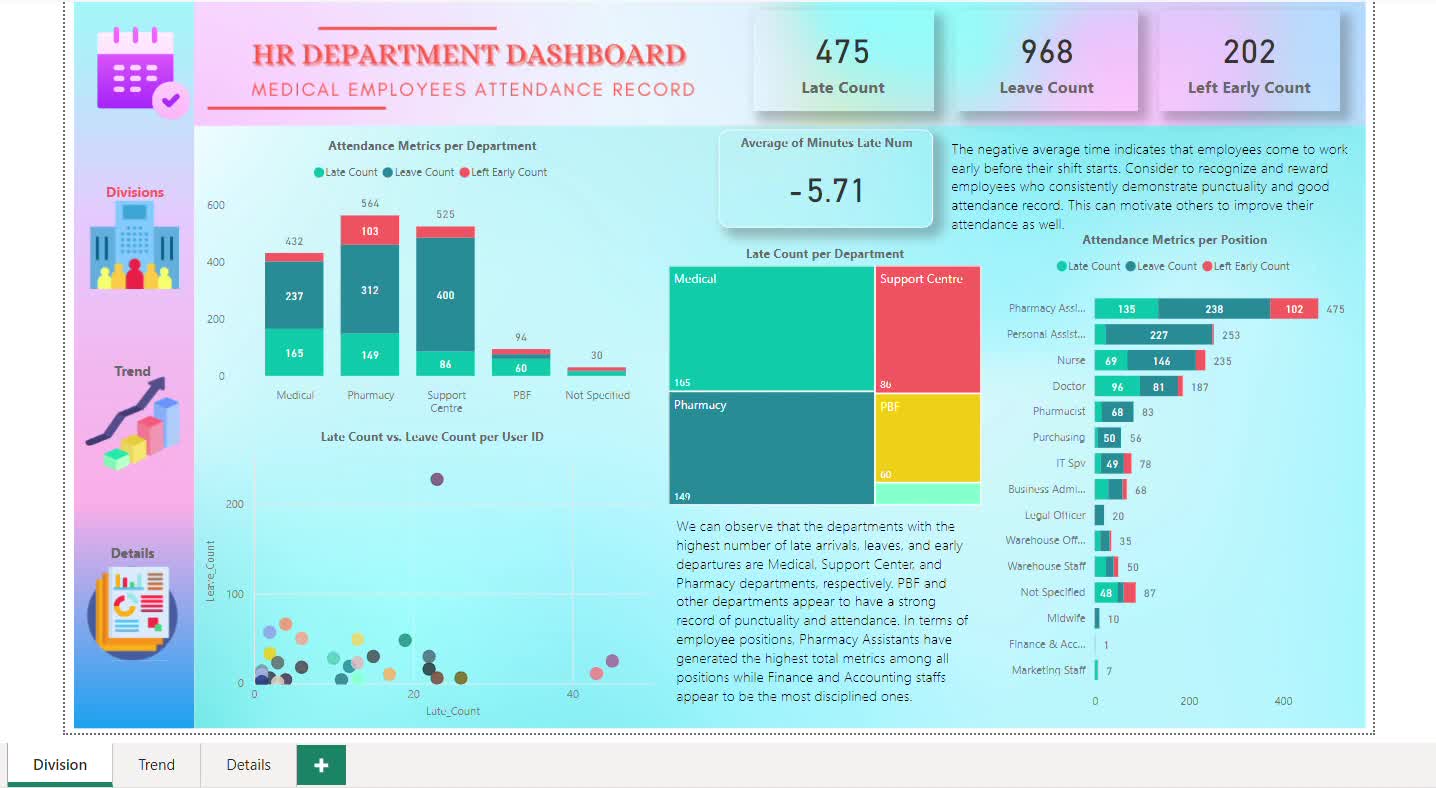
1.Identify the most disciplined and undisciplined employees and divisions.
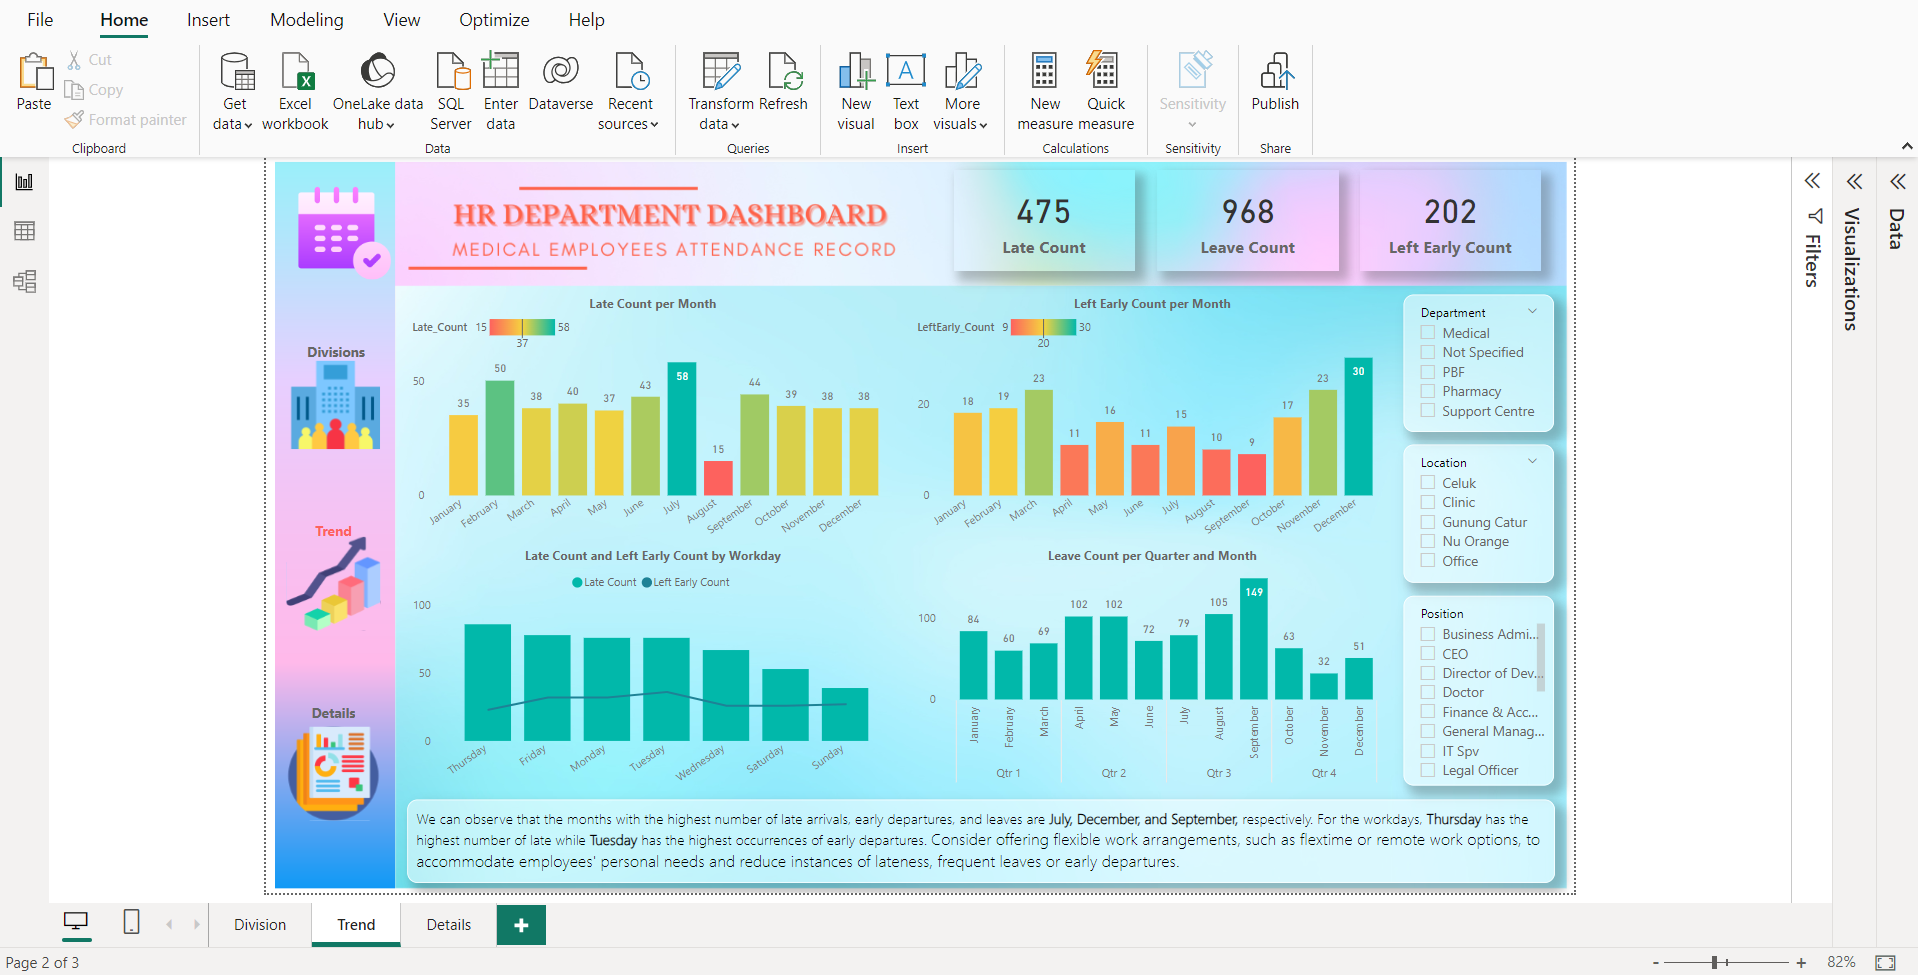
2.Create a visualization with the analysis of weekdays and months when the most employees were late/absent (either for vacation or sick leave).
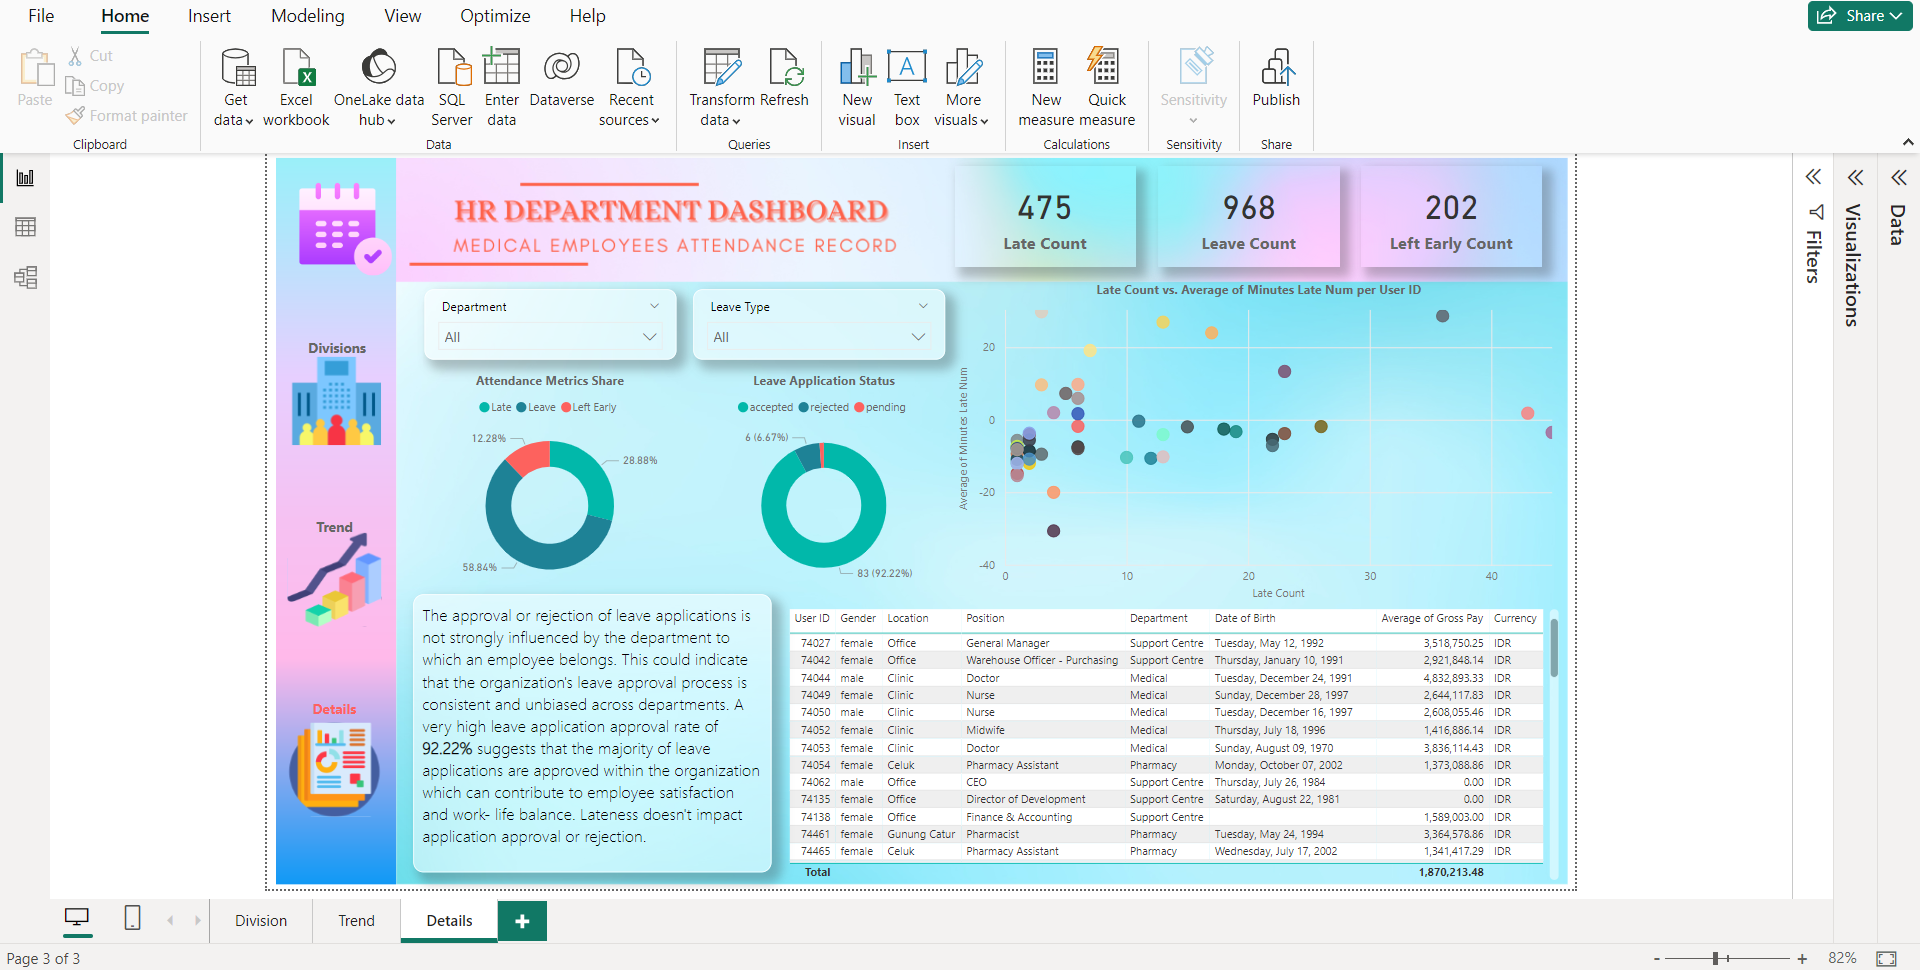
3.Answer the following questions. Which heads of departments tend to forgive employees for lack of discipline? Are there any favorites for any heads of departments (perhaps some employees are always forgiven for being late, given time off, etc.)?
The tasks were performed using PostgreSQL and Power BI for data cleaning and transformation.
We also used Power BI to create three Dashboards with visualization, written insights and recommendations for each question.


Please see attached file for the detailed report.

